Special: Caching Events
Tracee has an events caching (in-memory) mechanism. In order to check latest caching options you may execute:
$ ./dist/tracee --cache help
Read
Before continuing, please read the architecture page, in order to understand the tracee pipeline concept, AND the [performance page], to understand possible pain points.
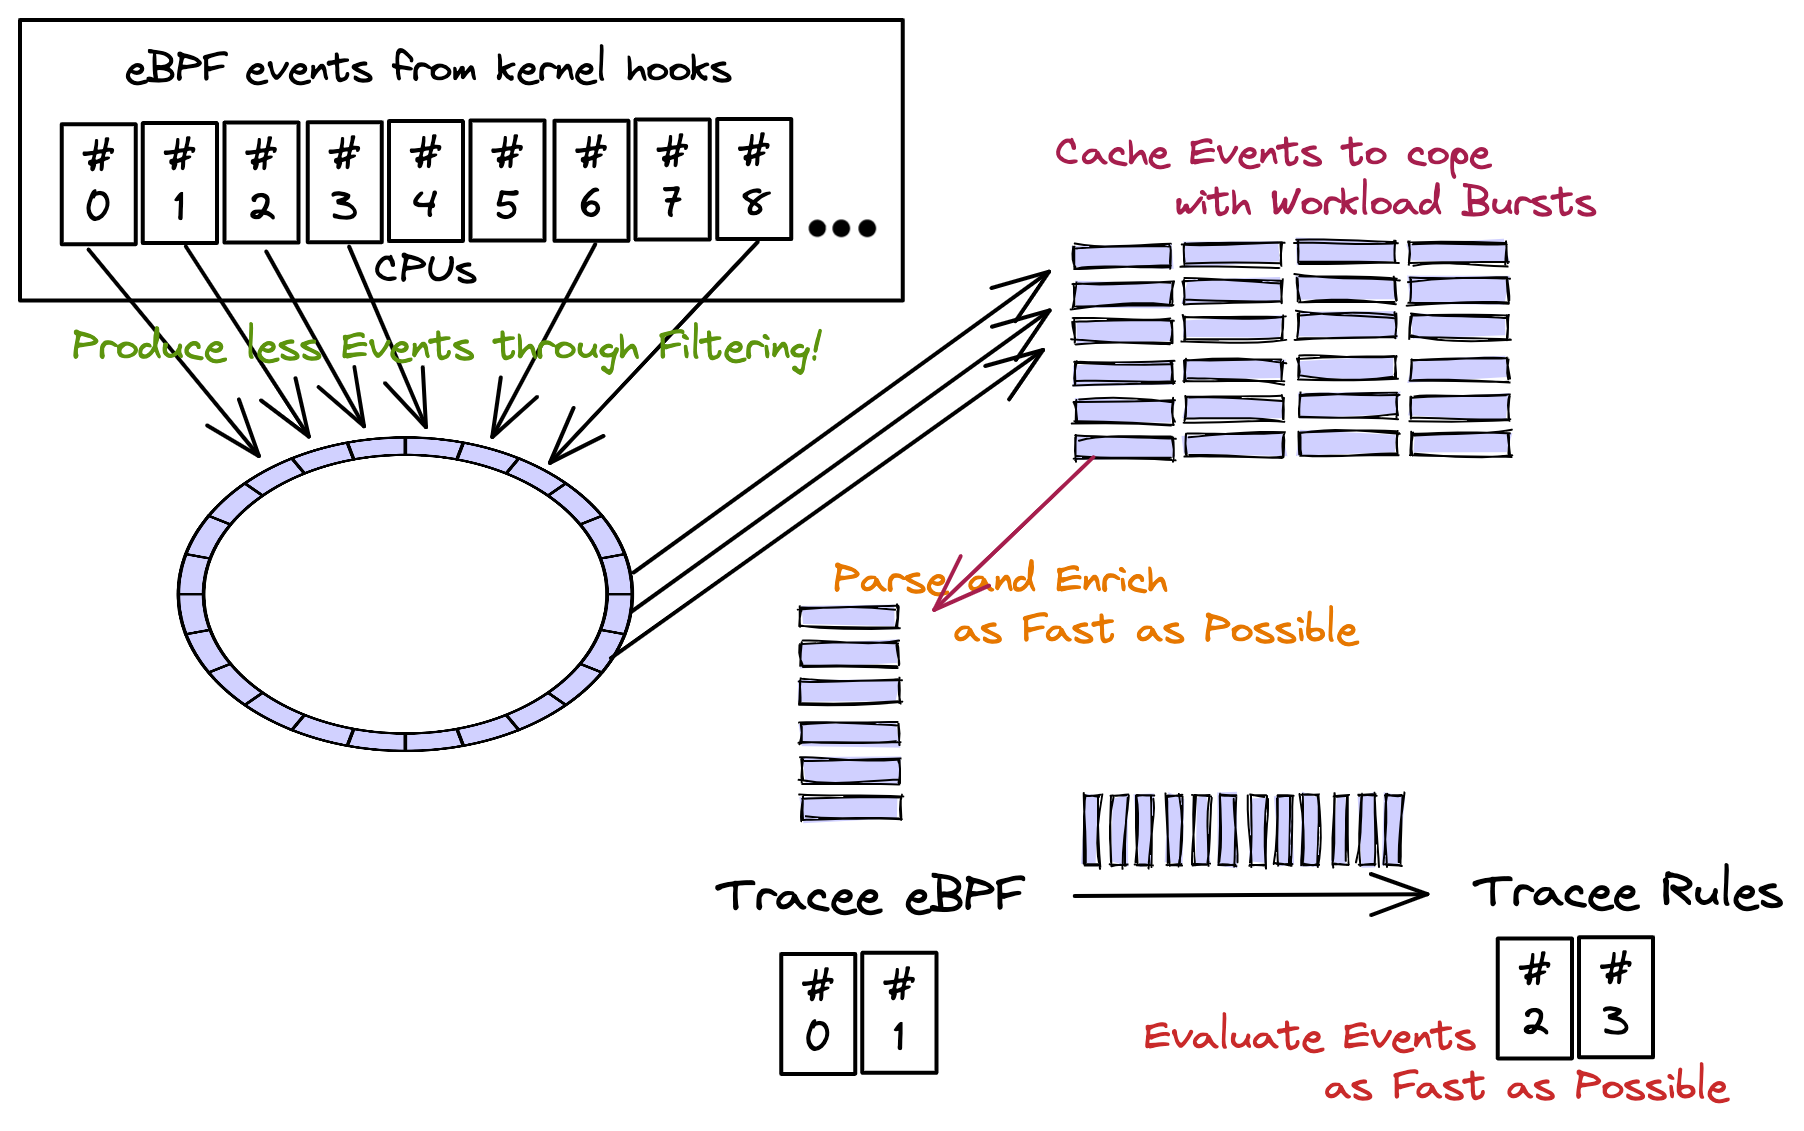
The caching happens in userland, it is an in-memory caching, and it helps with workload bursts: if kernel produces more events than userland is capable of processing then the events are kept in a sizeable cache (defined by user) so they're not lost (if cache isn't full).
The effects of this are the following:
-
Detections might be delayed because of workload bursts, but not lost (if cache isn't full).
-
Event losses from the kernel perf/ring buffer will only happen when cache is full.
-
Any difference in ratio production:consumption can be mitigated temporarily.
Use caching
Example using 1GB cache, container enrichment in the pipeline, argument parsing so arguments are formatted in a human consumable way:
$ sudo ./dist/tracee \
    --cache cache-type=mem \
    --cache mem-cache-size=1024 \
    --containers -o format:json \
    -o option:parse-arguments \
    -trace container \
    --crs docker:/var/run/docker.sock
We are using most of the options that could cause latencies in the event pipeline BUT we're not piping the events to tracee-rules.
Attention
If you pipe tracee output to another tool, like jq:
| jq -c '. | {cgroupid, processname, containername}'
jq might not be as fast as how tracee is capable
of writing events to it (just like tracee-rules could do if being slow
evaluating events).