Special: Performance
Read
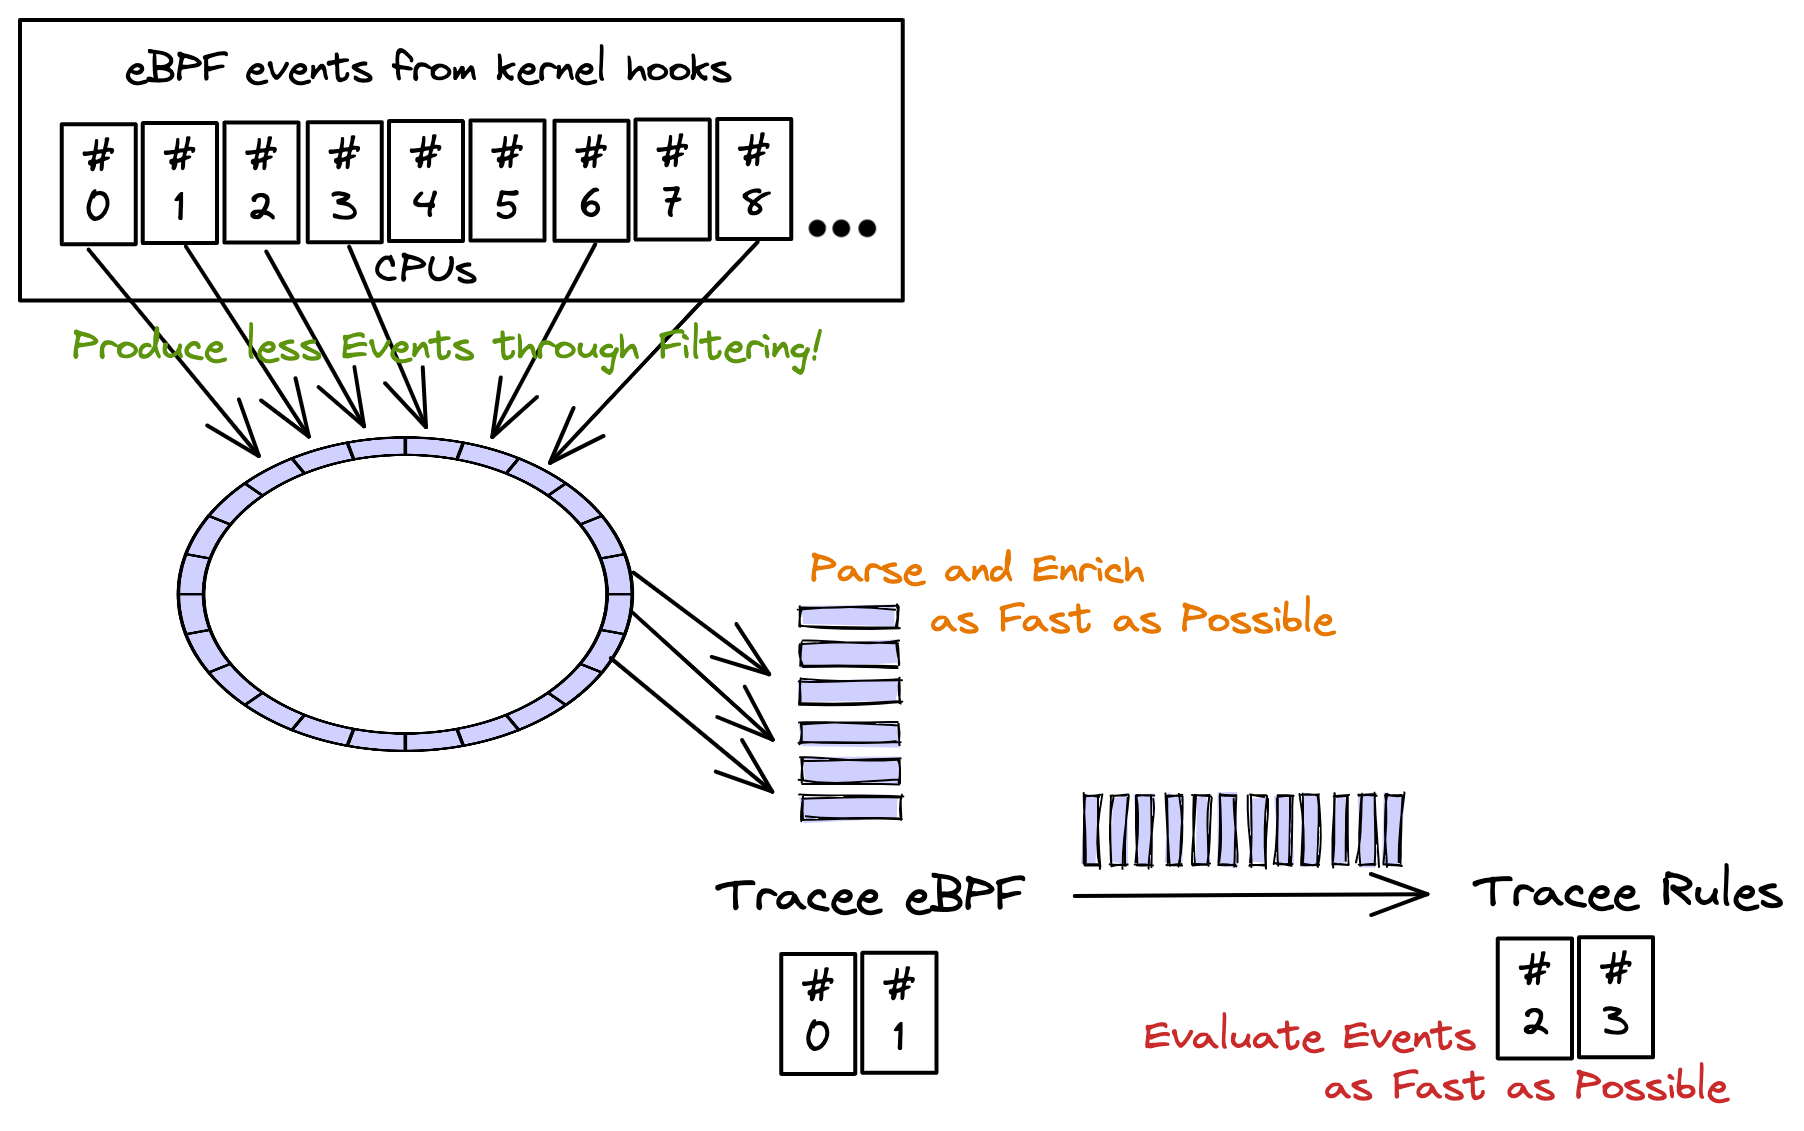
Before continuing, please read the architecture page, in order to understand the tracee pipeline concept.
Pain Points
From the tracee pipeline concept page, you learned that there might be 2 pain points regarding tracee performance:
-
Path between kernel and tracee-ebpf (through perfbuffers + golang channels)
- The only way to reduce the amount of events to userland is by bringing all filters into eBPF programs. There are some problems by doing that: the eBPF programs can't be too big, or too slow, not to impact the kernel performance (one of the reasons why eBPF virtual machine exists: to sandbox eBPF code).
-
Path between tracee-ebpf and tracee-rules (currently: a pipe, future: a channel)
-
Processing, parsing and enriching events in userland needs to be unblocking AND as fast as possible. Any extra processing in tracee-ebpf might delay the delivery of events from the kernel all the way down to tracee-rules signatures.
-
The communication in between tracee-ebpf and tracee-rules needs to be fast and not to block the consumption of events coming from the kernel. If this is blocked, then tracee will start loosing events because it can't catch up with the speed the events are being created in kernel.
-
tracee-rules processing needs to be as fast as possible. Taking too long to evaluate a detection from each received event will slow down the consumption of the pipe in between tracee-ebpf and tracee-rules, delaying also the path in between the kernel and tracee-ebpf.
-
Addressing Pain Points
-
Path in between kernel and tracee-ebpf:
- eBPF programs already do filtering in-kernel but not for all possible filter inputs (this is being improved for next releases).
-
Path in betwen tracee-ebpf and tracee-rules:
-
From measurements, the pipe used in between tracee-ebpf and tracee-rules processes is NOT a bottleneck BUT the gob output format (input format for tracee-rules) has better performance.
-
The signatures processing might be a bottleneck. Using golang signatures in tracee-rules, for evaluating detections, has bigger performance and should be considered whenever possible.
-
Test Concepts
Example using container enrichment in the pipeline, argument parsing so arguments are formatted in a human consumable way, detecting syscall that generated the event:
$ sudo ./dist/tracee-ebpf \
    --containers -o format:json \
    -o option:parse-arguments \
    -trace container \
    --crs docker:/var/run/docker.sock
We are using most of the options that could cause latencies in the event pipeline BUT we're not piping the events to tracee-rules.
Attention
If you pipe tracee-ebpf output to another tool, like jq:
| jq -c '. | {cgroupid, processname, containername}'
jq might not be as fast as how tracee-ebpf is capable
of writing events to it (just like tracee-rules could do if being slow
evaluating events).