Access Tracee Metrics in Prometheus and Grafana
Tracee exposes a metrics endpoint. This makes it possible to monitor Tracee like other cloud native workloads.
In this tutorial, we will showcase how to access Tracee metrics through Prometheus and Grafana running through docker containers. The tutorial can easily adapted to Kubernetes workloads with the configuration provided.
Tutorial Overview
Grafana is a visualization tools for exported metrics and logs, most commonly used alongside Prometheus.
Since version 0.7.0, tracee exports useful runtime metrics to Prometheus.
By using Grafana and the new metrics from tracee, we can deploy a simple dashboard which tracks the tracee instance performance and outputs.
There are two options for accessing Tracee metrics:
- Running the Tracee Docker Container Image -- Shown in this tutorial
- Running the Tracee Helm Chart -- Detailed as part of the Promtail-Tracee tutorial
Tracee Docker Container Image
These metrics exports are enabled by default in all docker images and can be
enabled using the --server metrics flag.
Prerequisites
The following tools must be available for use, they can all be installed either through docker or installed/built on your machine. Note that you need to be on a Linux machine to follow the Docker tutorial. Alternative, on a MacBook it is possible to use Vagrant with Parallels as detailed in the following tutorial: Running Tracee on Mac with Parallels and Vagrant
Run Tracee with Metrics Enabled -- The Docker Command
Tracee can be most easily deployed with metrics enabled by default and port forwarded through the following commands:
docker run --name tracee -it --rm \
  --pid=host --cgroupns=host --privileged \
  -v /etc/os-release:/etc/os-release-host:ro \
  -v /var/run:/var/run:ro \
  -p 3366:3366 \
  aquasec/tracee:latest \
  --server metrics
Of course, the forwarded metrics ports can be changed, but you should note that some of the later instructions depend on these ports.
If running Tracee locally through built binaries, the metrics address may be
overrides with the --listen-addr flag.
Run Prometheus and Configure it to Scrape Tracee
Install Prometheus or pull it's Docker image. Then create the following
configuration file, call it prometheus.yml to scrape Tracee:
# A scrape configuration containing exactly one endpoint to scrape:
# Here it's Tracee.
scrape_configs:
  # The job name is added as a label `job=<job_name>` to any timeseries scraped from this config.
  - job_name: 'tracee'

    # Override the global default and scrape targets from this job every 5 seconds.
    scrape_interval: 5s
    metrics_path: /metrics

    #Scrape tracee's default metrics hosts.
    #If forwarding different ports make sure to change these addresses.
    static_configs:
      - targets: ['localhost:3366']
Note that the localhost:3366 might have to be replaced with your IP address. The IP address can be found with the following command:
/sbin/ifconfig
We can then start Prometheus with the following command:
prometheus --config.file=/path/to/prometheus.yml
Or alternatively with docker:
docker run \
    -p 9090:9090 \
    -v ./prometheus.yml:/etc/prometheus/prometheus.yml \
    prom/prometheus
Ensure that prometheus can scrape the Tracee target: Open the Prometheus UI at http://localhost:9090
Under Status < Targets will be the scrape targets listed.
If successful, move to the next step, otherwise consult with the Prometheus documentation.
Run Grafana to display Tracee's Prometheus Metrics
After successfully deploying Tracee and Prometheus we may now run Grafana to visualize it's metrics.
Install Grafana using the Grafana container image:
docker run -d -p 3000:3000 --name=grafana grafana/grafana-enterprise
Next, you should be able to access the Grafana UI throug: http://localhost:3000.
After entering the website, logging in with username and password admin (and
changing your password if you wish), you should see the homepage:

Add your data source by hovering the configuration tab (the gear icon), selecting "Data Sources" and pressing "Add Data Source" at the top left. Create a Prometheus Data Source and point it's URL to the relevant location (usually http://localhost:9090)
Note that you might have to use your local IP address again instead of localhost.
You may now either create your own Dashboard or import our default dashboard.
Import Tracee's Default Dashboard
First download our Grafana Dashboard's json here.
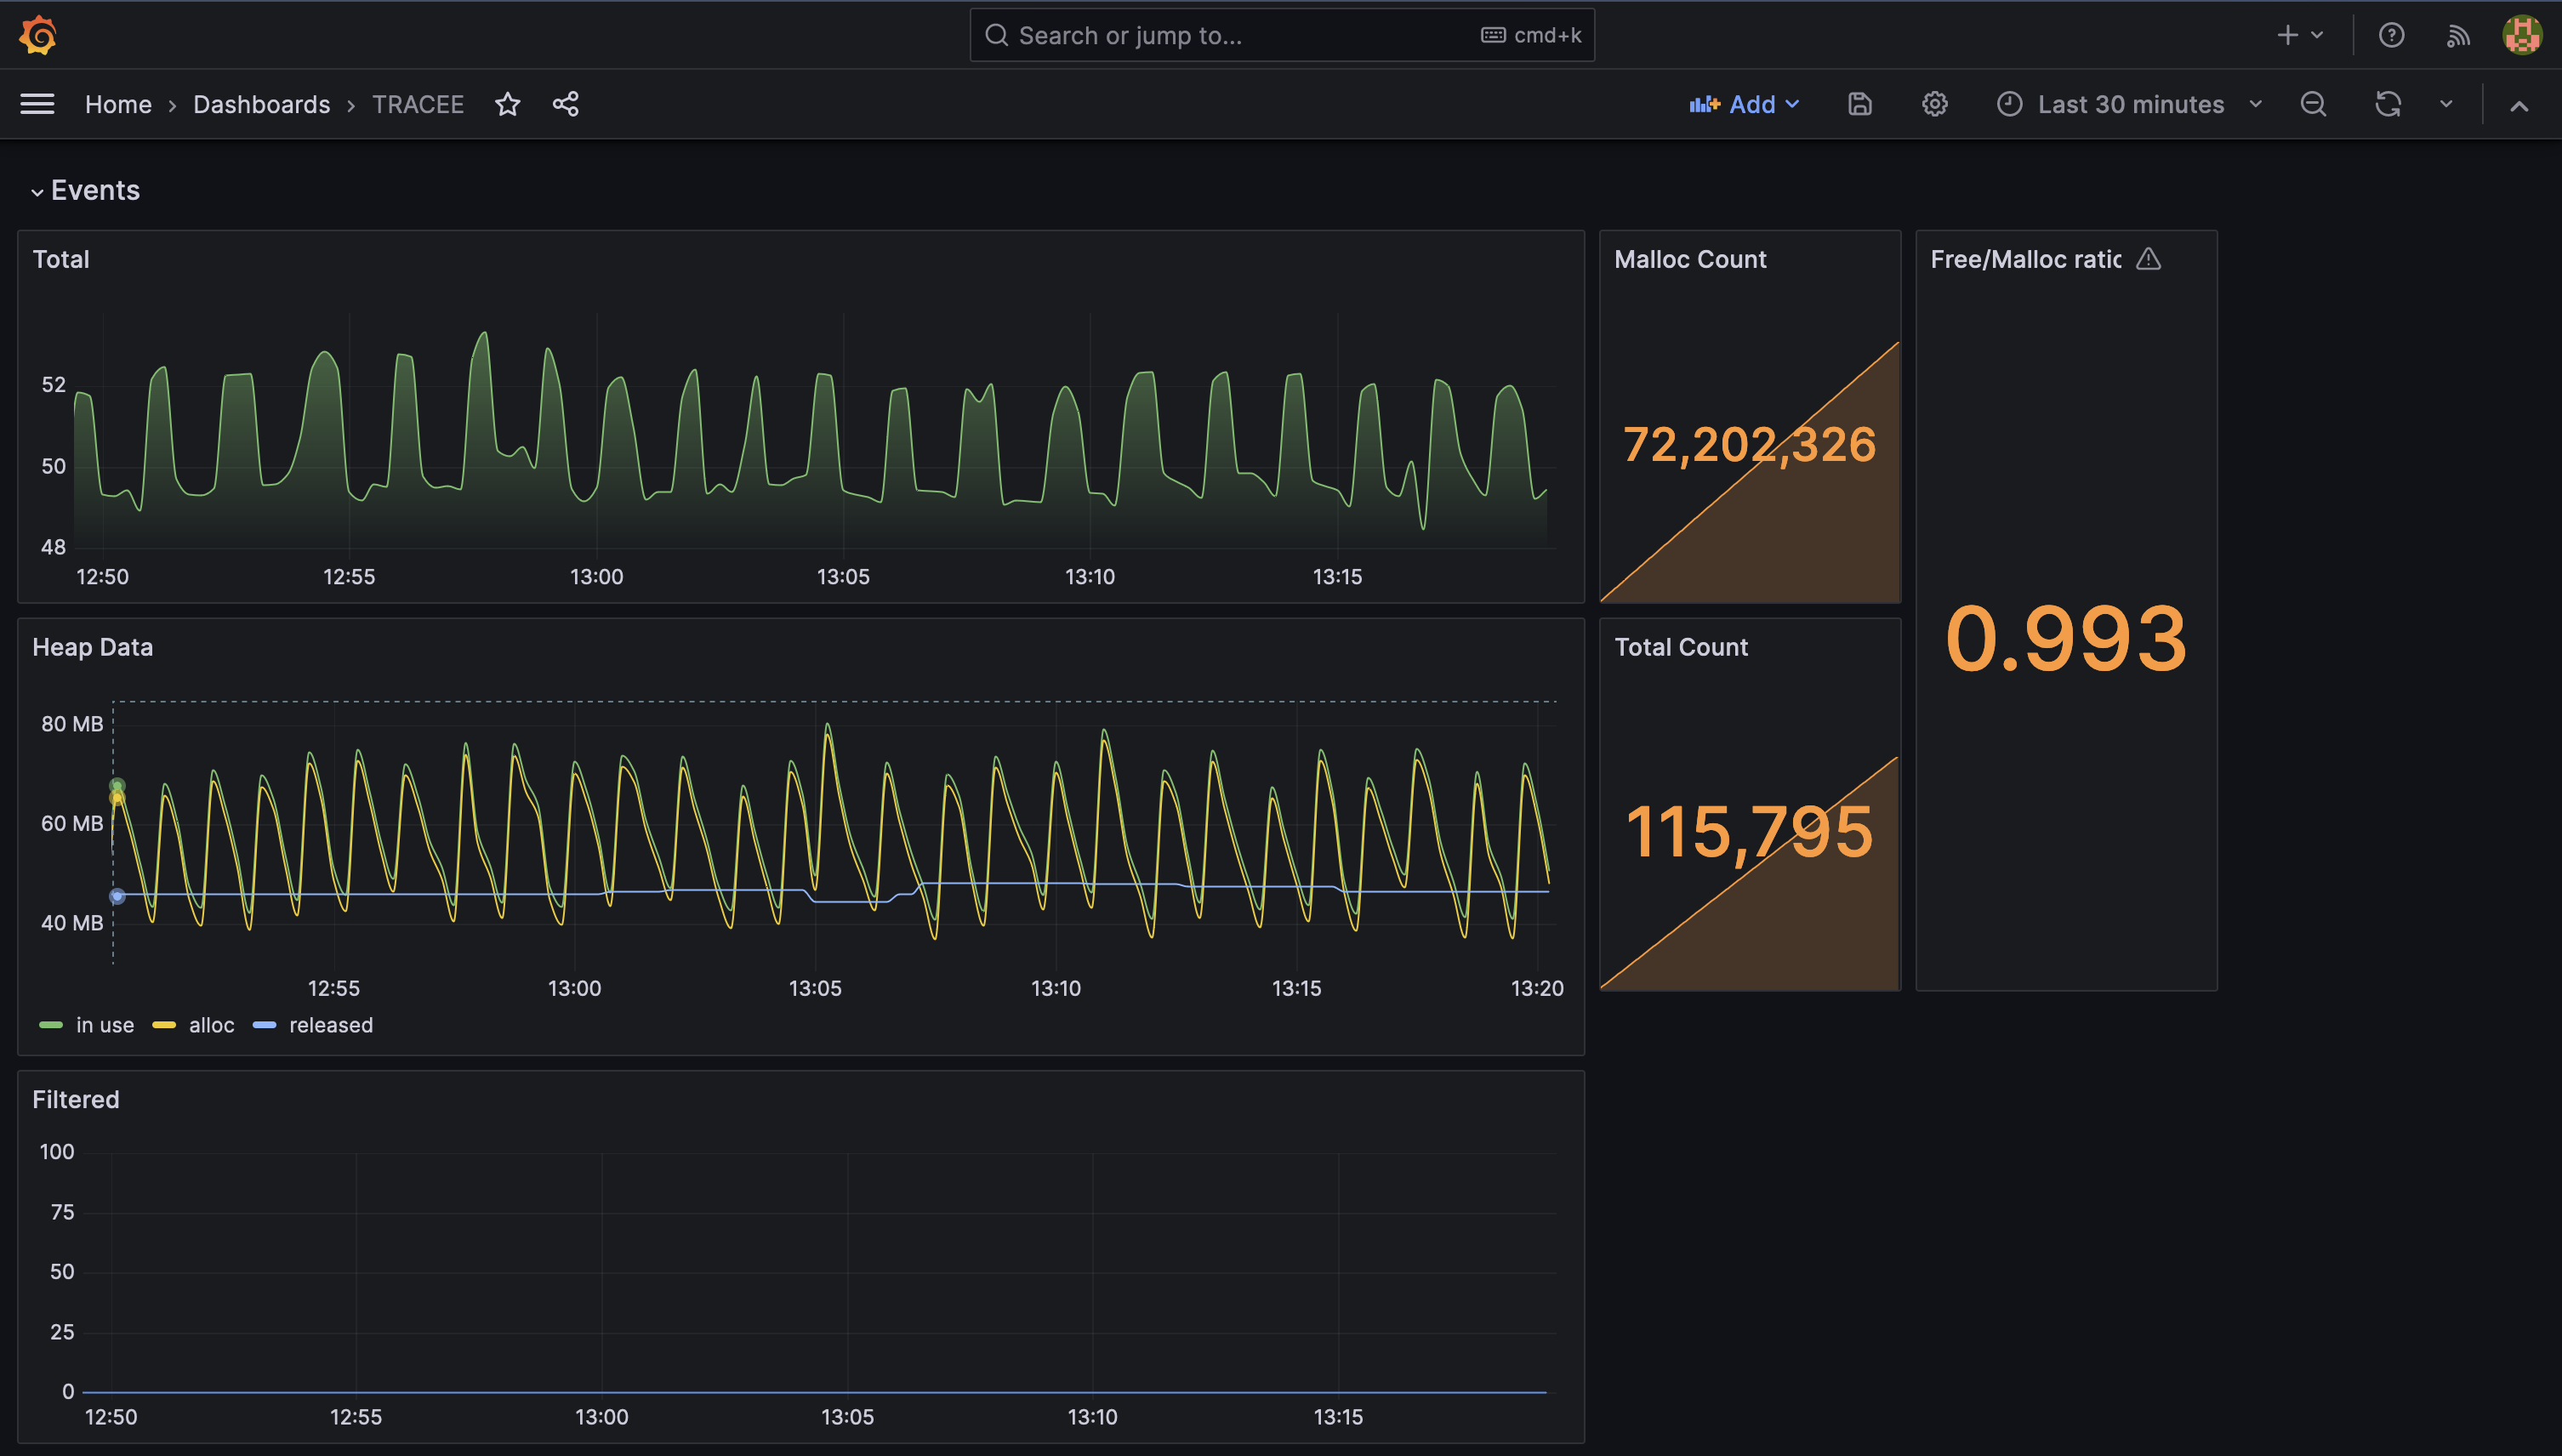
After adding the data source hover on the plus icon in the sidebar and select "Import". Press "Upload JSON File" at the top of the page and select the downloaded json from your file browser. Change the name and Dashboard UID if you wish and press "Import" to finish.
Finally you will be redirected to the dashboard 🥳